AdventureWorks Sales Performance and Product Insights Dashboard
Tools Used: SQL Server, SSMS, Python (Pandas, NumPy, Seaborn, Matplotlib), Power BI, Excel
Duration: 4 weeks
Link: GitHub – AdventureWorks_Project
entureWorks is a fictional global manufacturing company provided by Microsoft for sample analysis. The business lacked a centralized system to analyze sales performance, product trends, and customer behavior across regions and time. Stakeholders were unable to make data-driven decisions due to disconnected tables and lack of visual summaries.
My goal was to simulate a real-world business analytics environment by:
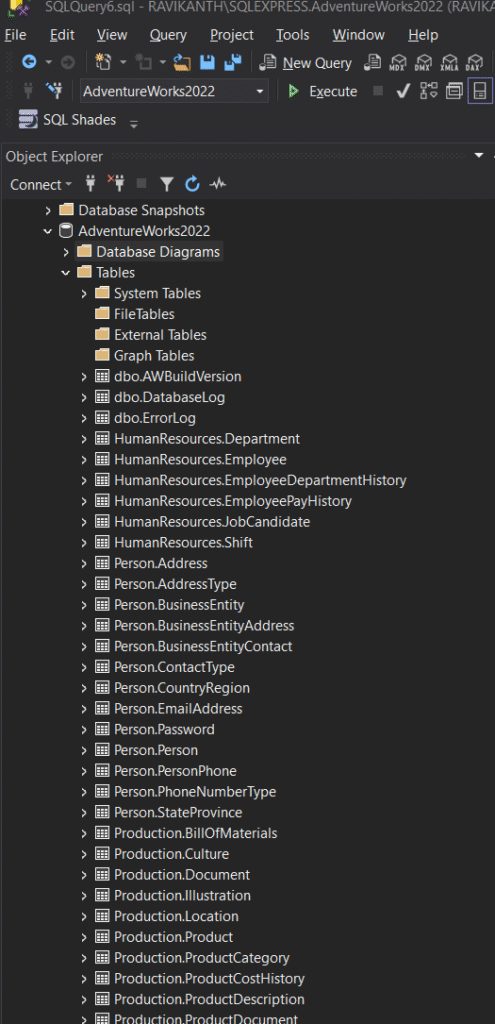
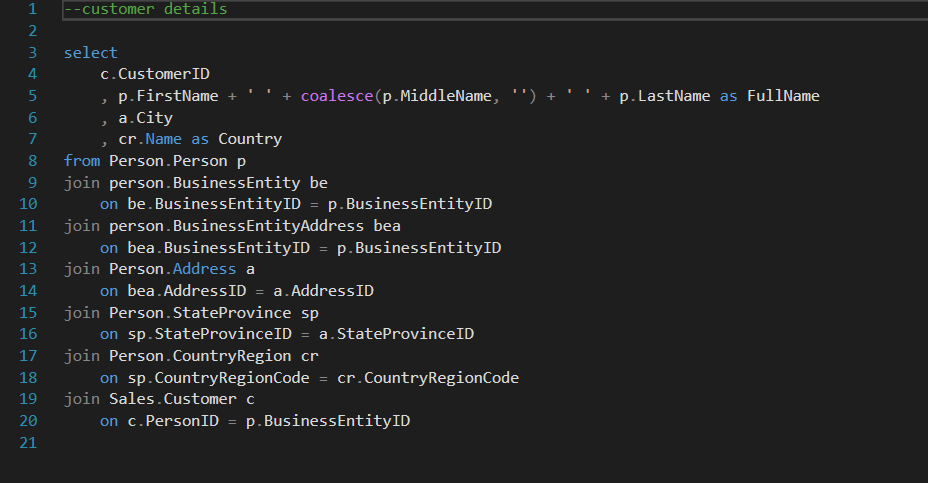
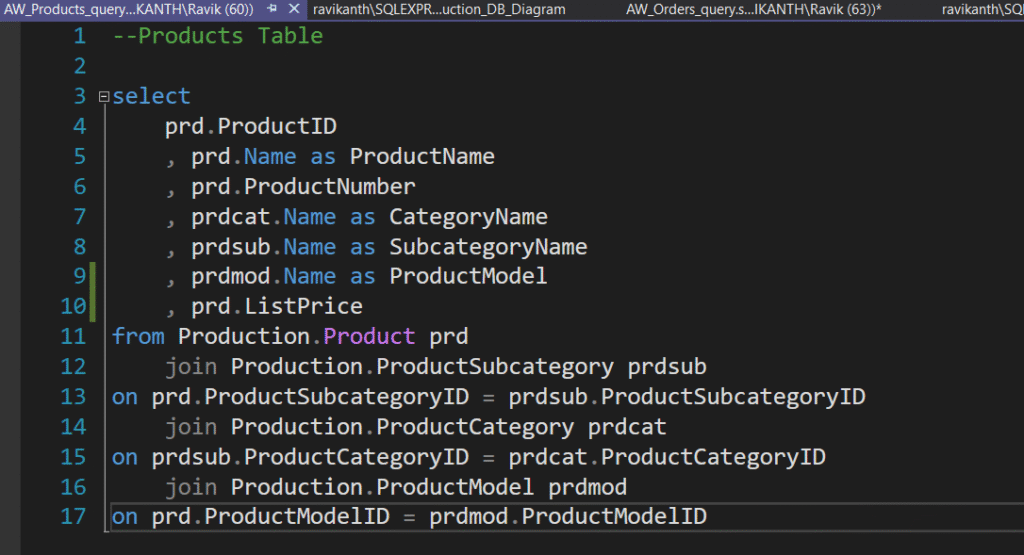
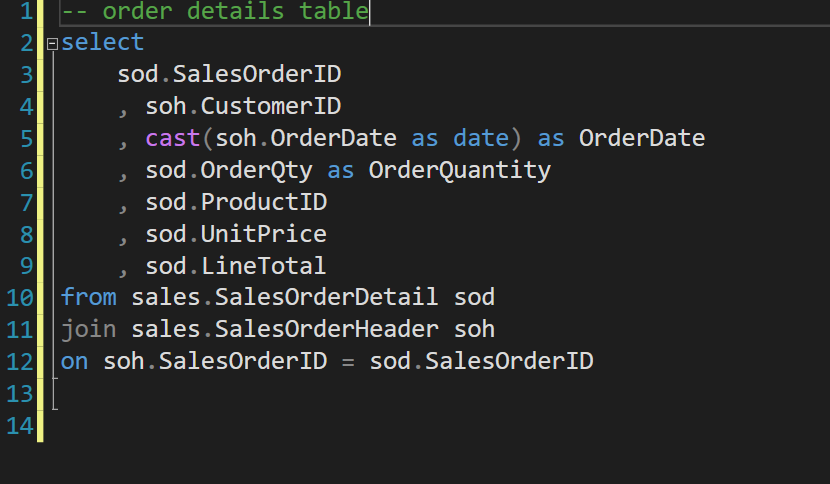
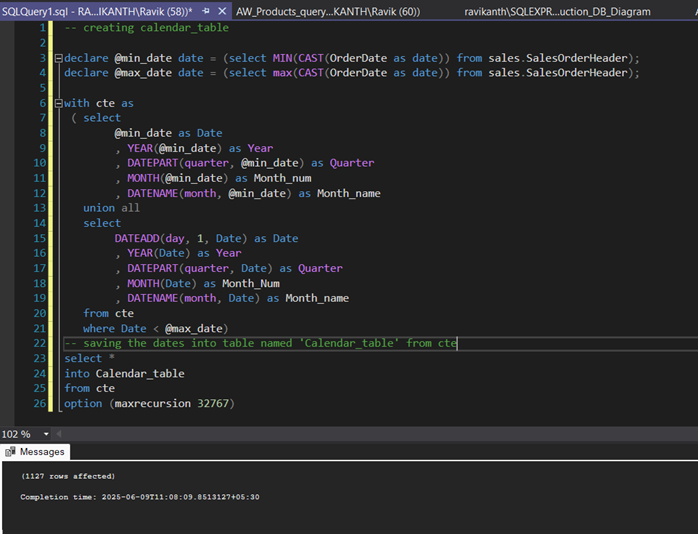
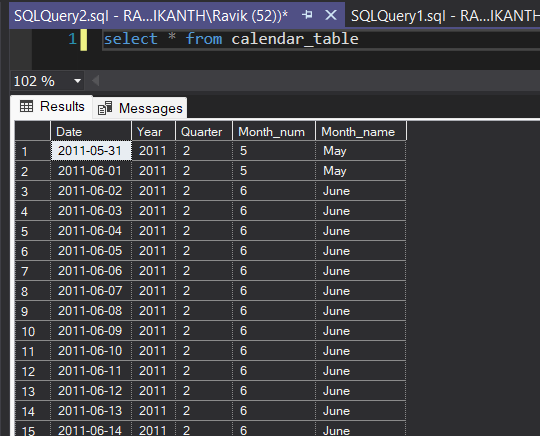
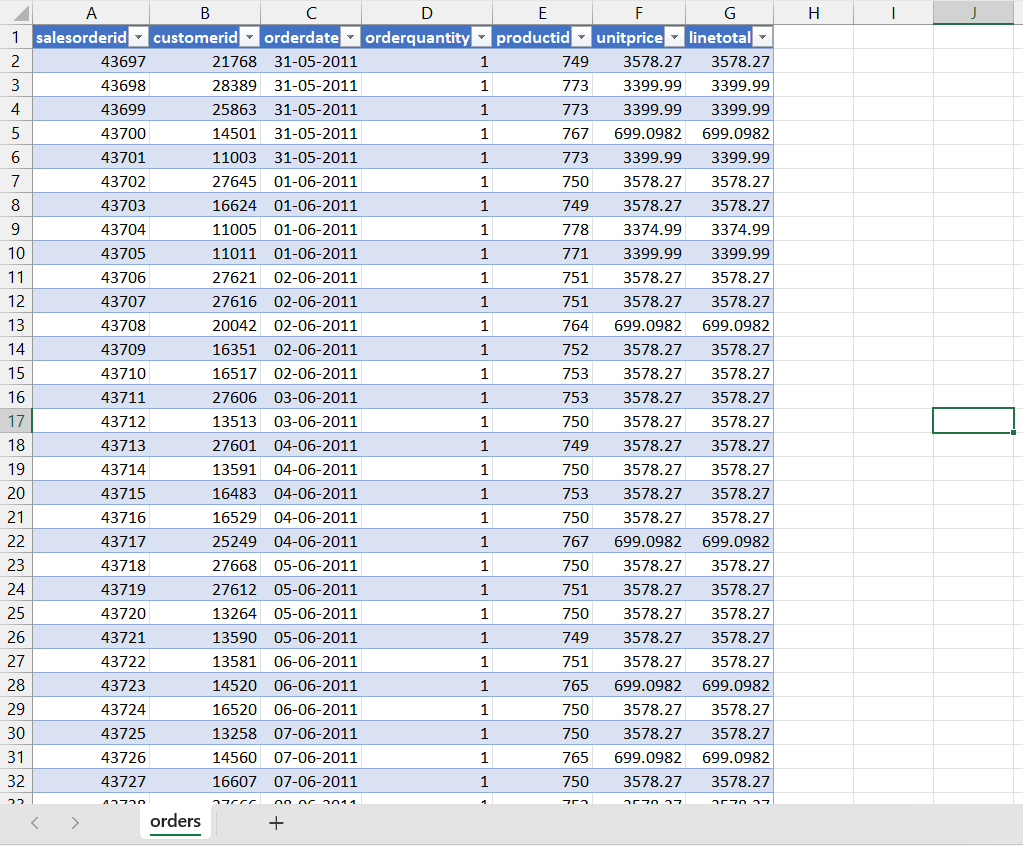
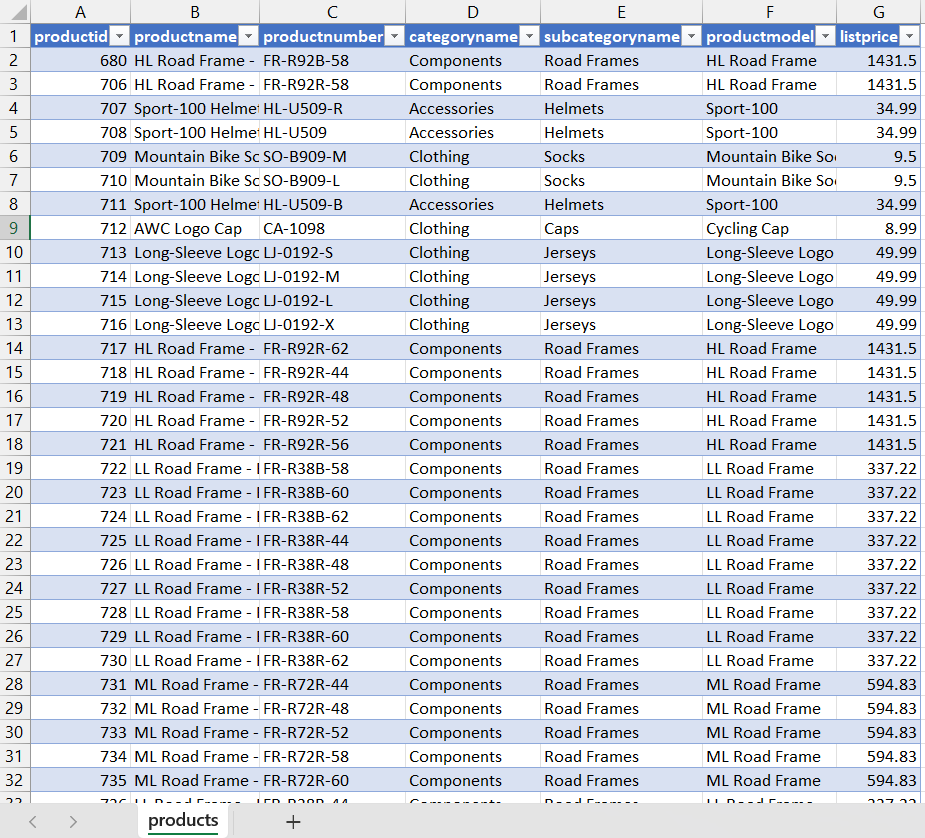
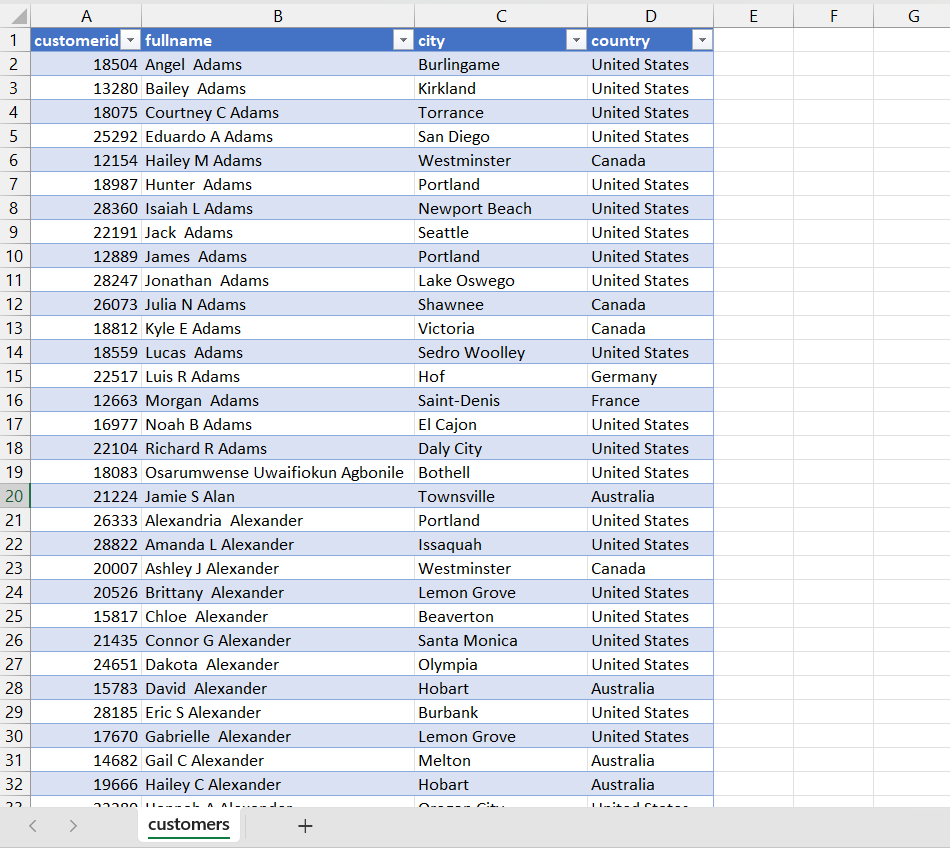
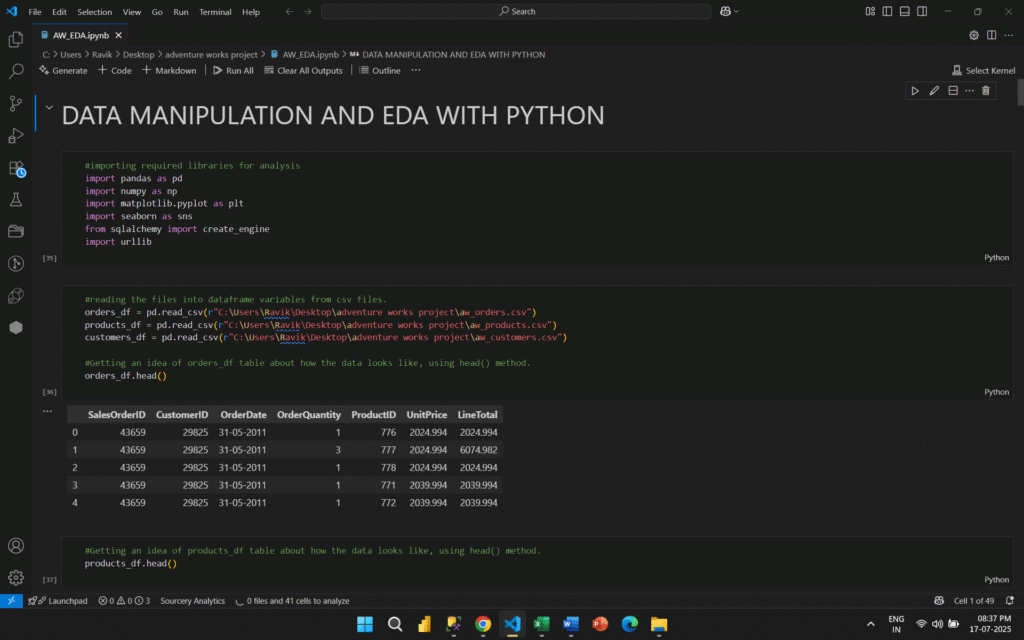
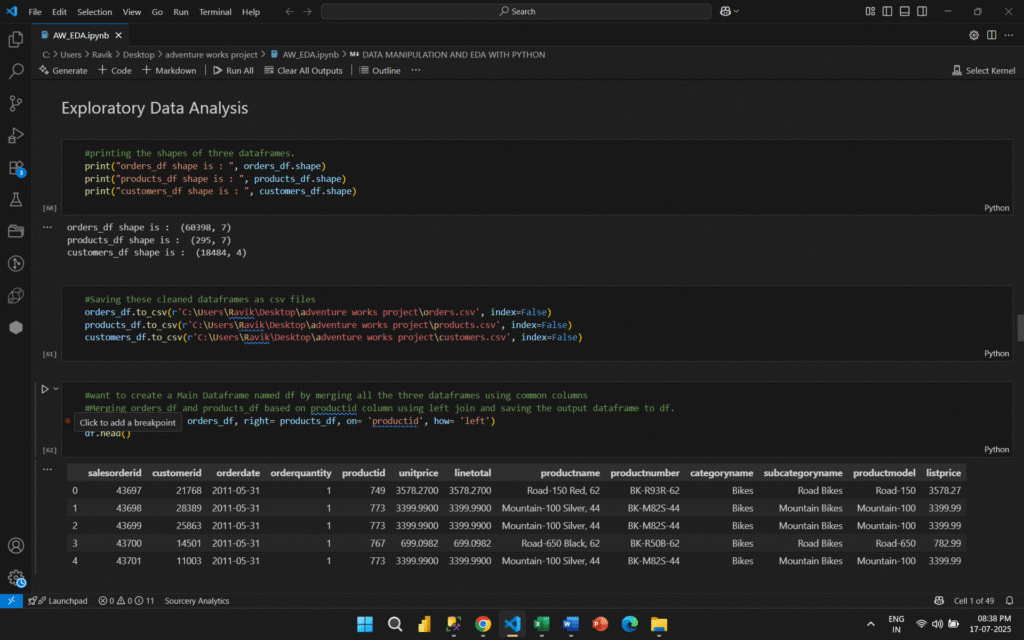
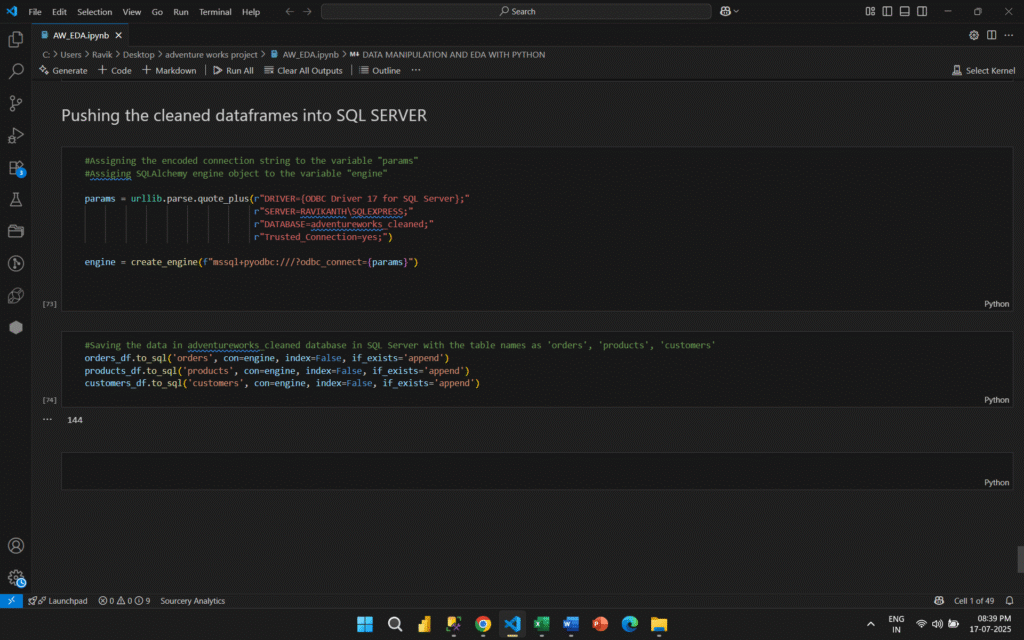
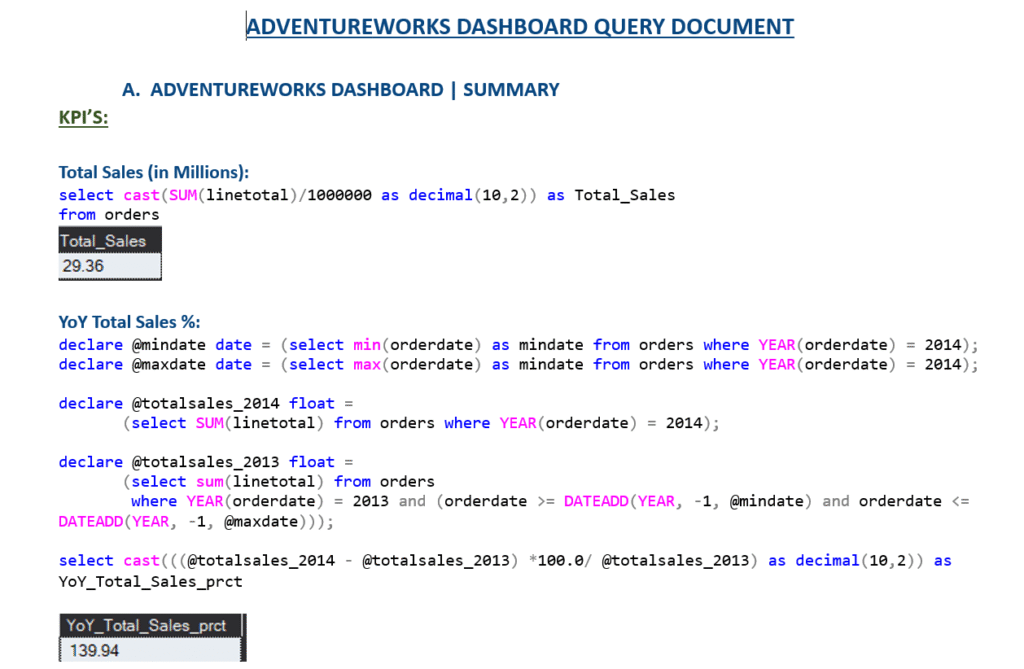
Cleaning and transforming large datasets from the AdventureWorks
.bakfile
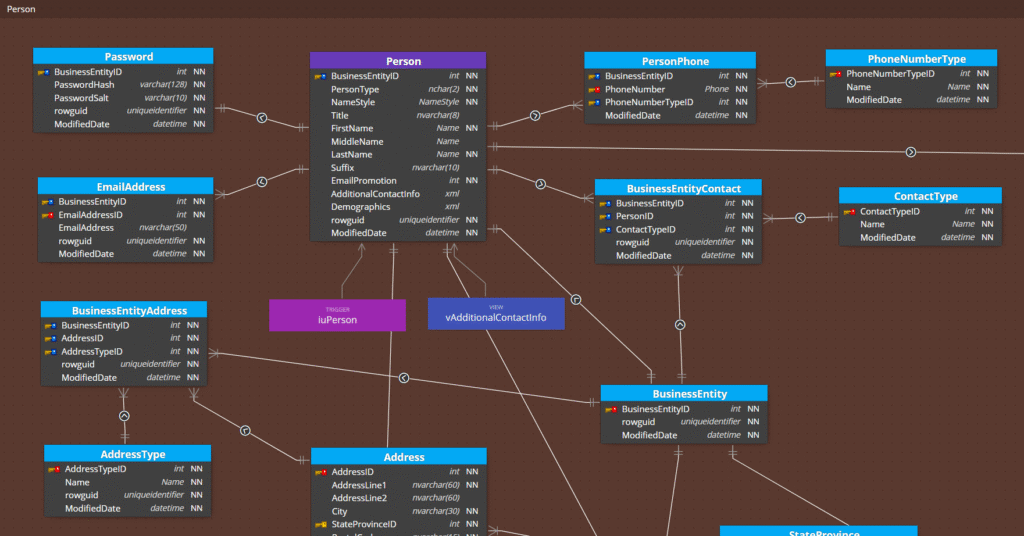
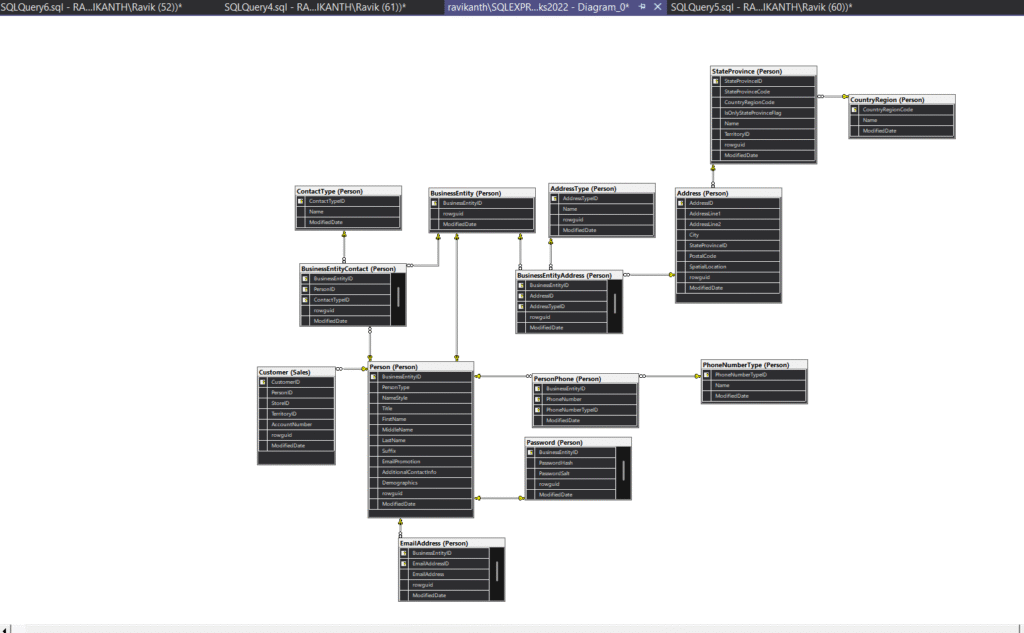
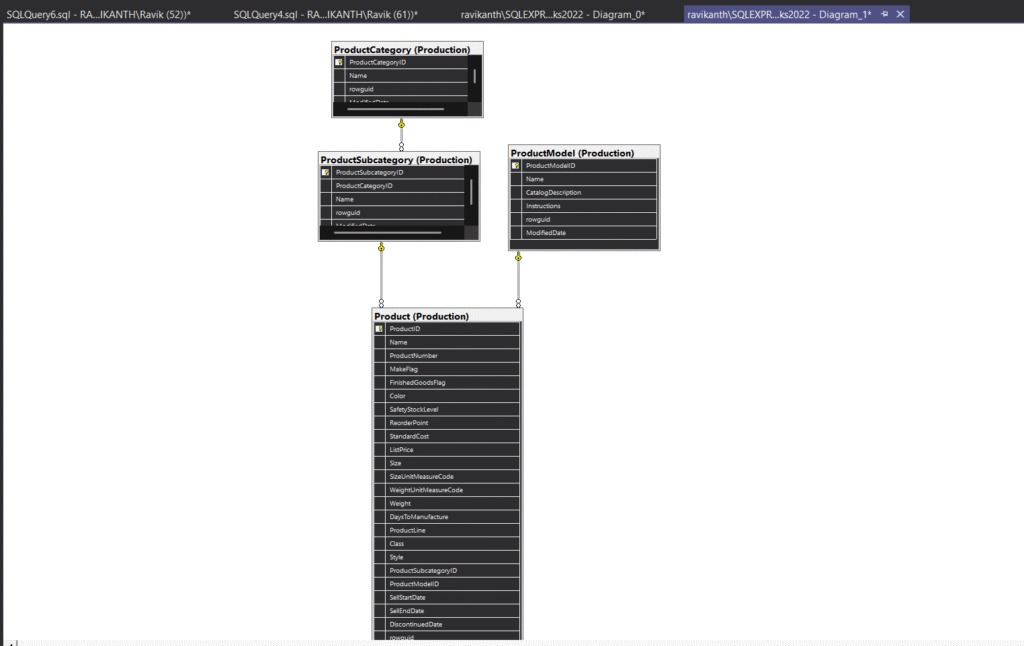
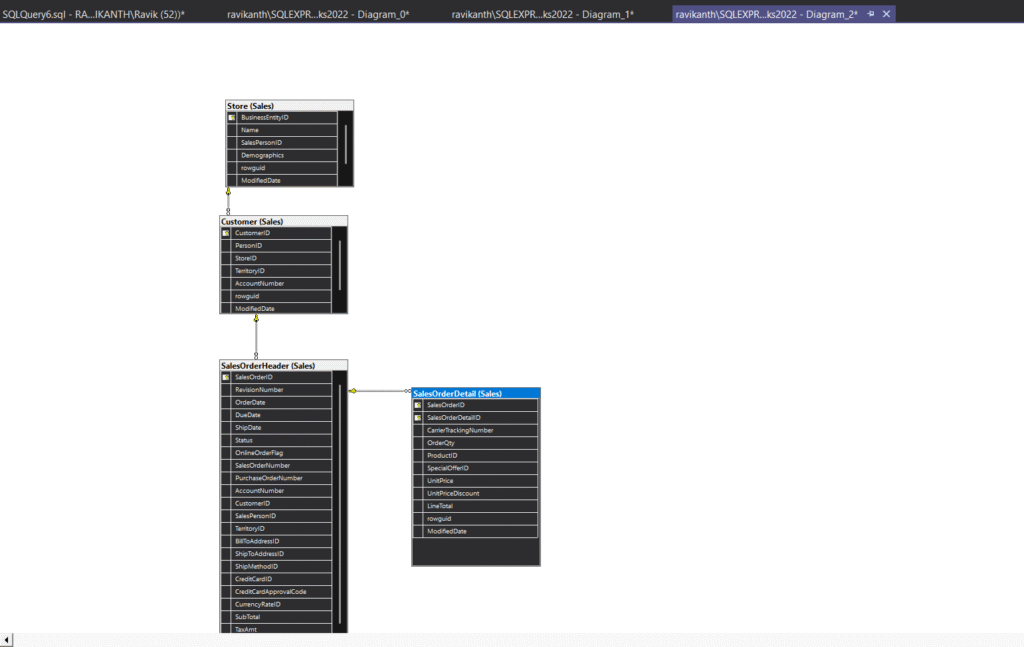
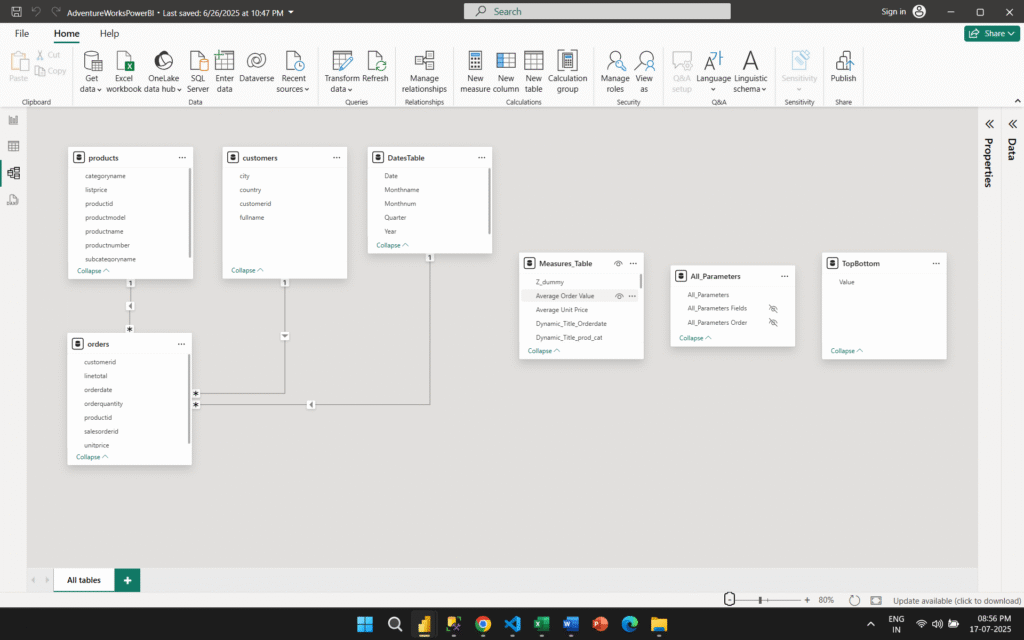
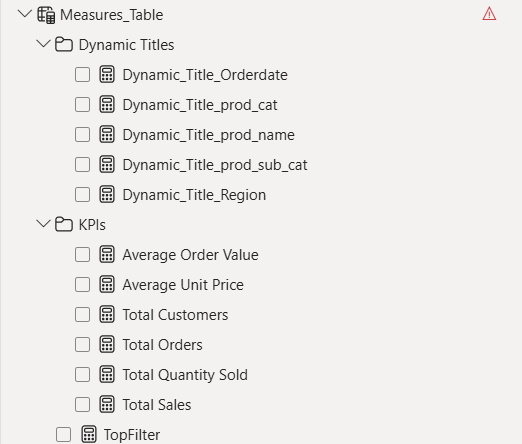
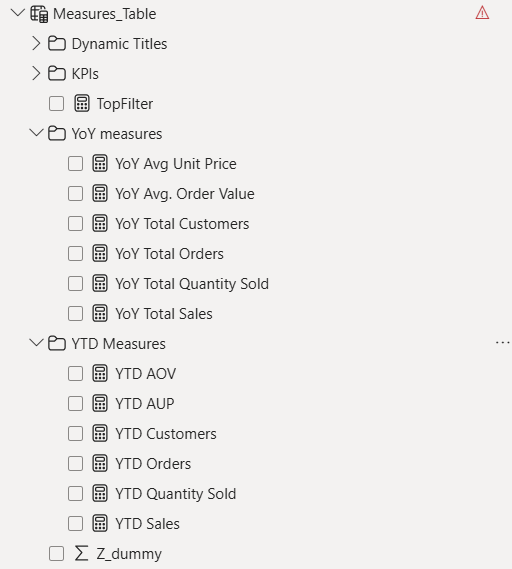
Designing a unified data model
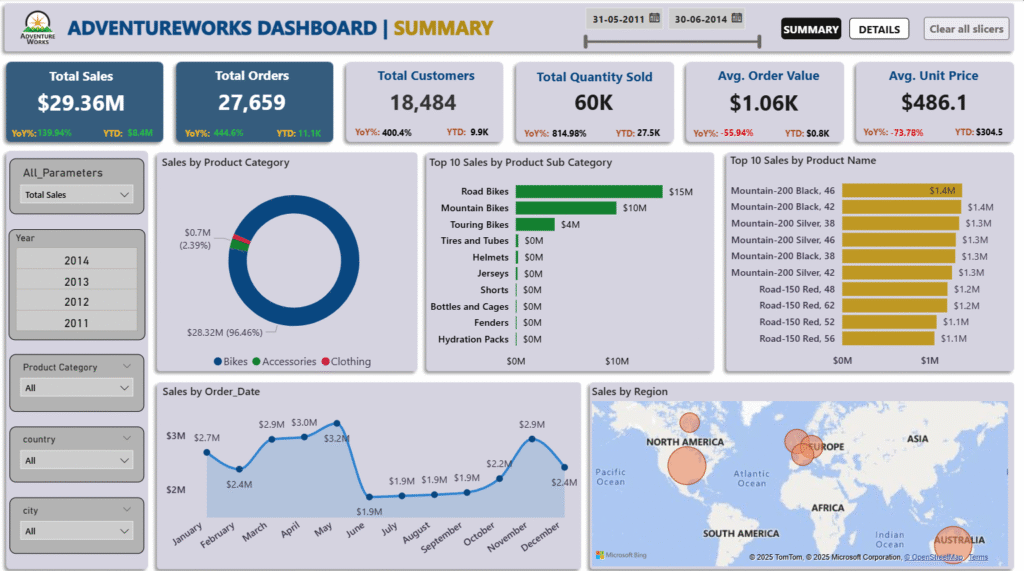
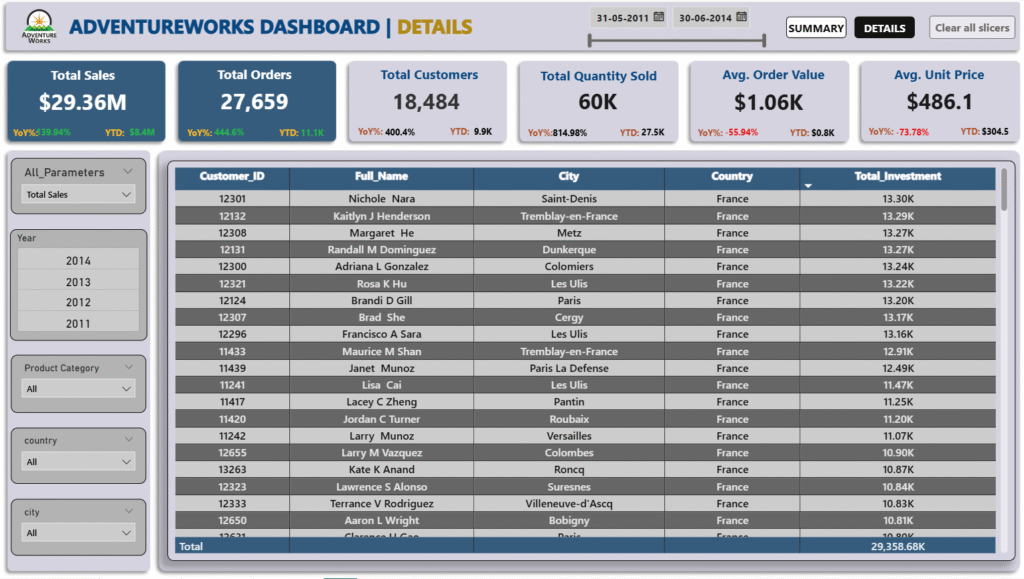
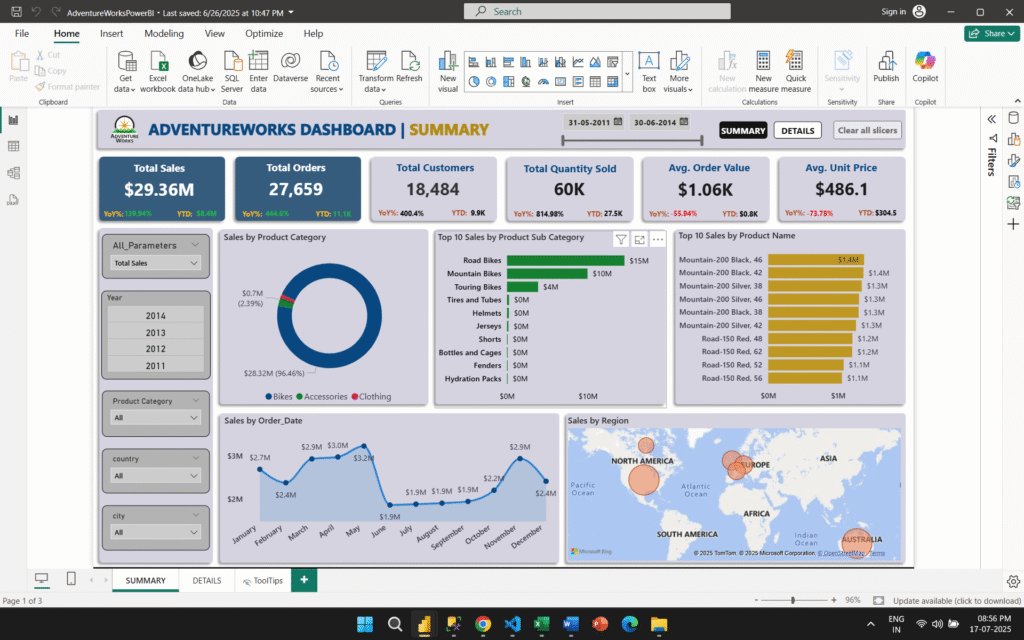
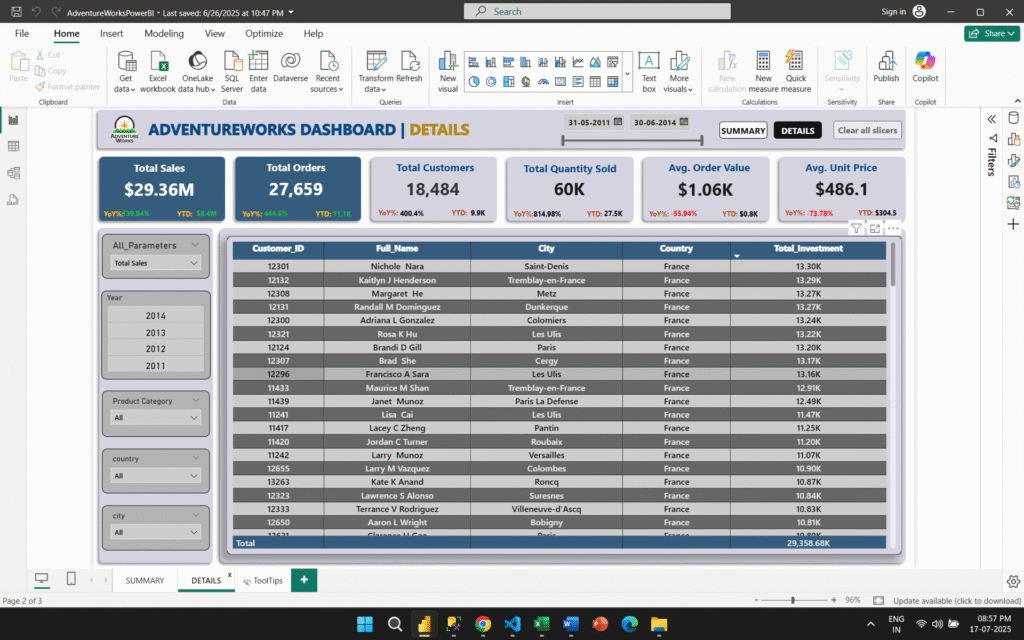
Building an interactive Power BI dashboard to deliver key sales and product performance metrics
Deriving actionable insights and simulating data-driven recommendations for executive teams
Here’s how I approached the project step-by-step:
1) Data Understanding & Extraction
Restored the AdventureWorks
.bakfile into SQL Server (over 71 relational tables across 5 schemas)Selected key tables from Person, Production, and Sales schemas
Wrote optimized SQL queries with joins, aggregations, and filters to extract relevant data
Used recursive CTEs to build a dynamic Calendar table
Sample images of Original database Shemas, Tables and Database diagrams are provided below.
Further, I divided this huge Database into small chunks by considering only the required tables from respected Shemas by running SQL Queries and created Database Diagrams for easy understanding. Schemas and Code Snippets are provided below.
Person Schema Diagram and the code for creating Customer Table with only the required columns from schema:
Production Schema Diagram and the code for creating Products Table with only the required columns from schema:
Sales Schema Diagram and the code for creating Orders Table with only the required columns from schema:
Created Calendar table using recursive cte for getting better results:
2) Data Cleaning & Structuring
Exported query outputs to Excel and converted them into
.csvfilesUsed Python (Pandas and NumPy) in Jupyter Notebook for additional cleaning and EDA
Pushed cleaned tables back into a new SQL database for dashboarding
3) Data Modeling & Dashboard Development
Connected cleaned data to Power BI
Built relationships and a custom Date table
Created calculated measures and KPIs using DAX including Total Sales, YoY Growth, AOV, Unit Price, etc.
Designed multi-page dashboards with slicers, tooltips, drill-throughs, and visuals for product, region, and customer-based analysis
Dashboard Features and Functionality:
- Created this dashboard by implementing dynamic view with resepct to different KPIs performing in different dimensions using Field Parameters.
- Additionally, added dynamic titles for more clarity of insights, added different slicers to slice the data to get more precise information.
- Created a Date Slider to get the insights in a particular point of time.
Finally, validated dashboard results by running SQL Queries in SSMS to ensure Data Accuracy.
4) Insights & Recommendations
Identified that Bikes contributed over 96% of revenue suggesting reliance on a single category
Discovered top customers from France, and strong potential in Canada and Germany
Found that AOV dropped by 55.94% between 2011 and 2014 indicating price sensitivity
Proposed bundling, cross-selling, and region-specific campaigns to increase revenue and reduce product dependency
Result
Built an end-to-end Business Intelligence Solution that answered 10+ stakeholder questions
Improved data accessibility and reporting speed through automation and structured queries
Created dynamic dashboards that summarized over $29M in sales, highlighting performance across product lines and countries
Simulated actionable strategies such as expanding premium product lines, increasing accessory promotions, and focusing on high-potential regions
Strengthened hands-on experience in SQL Server, Python for EDA, and Power BI for advanced DAX-based analytics
Project Highlights
KPI Metrics: YTD Sales, Total Orders, YoY Growth, AOV, Unit Price, Quantity Sold
Key Domains: Sales analytics, product performance, customer segmentation, regional trends
Visuals Built: Category/Subcategory analysis, Region-wise performance, Top products/customers, Time series trends
Challenges Overcome:
Performance lag due to large
.baksize resolved usingTOPclause for iterative testingFixed relational integrity errors while designing schema relationships in Power BI
Ensured accurate results by validating dashboard metrics using SQL scripts